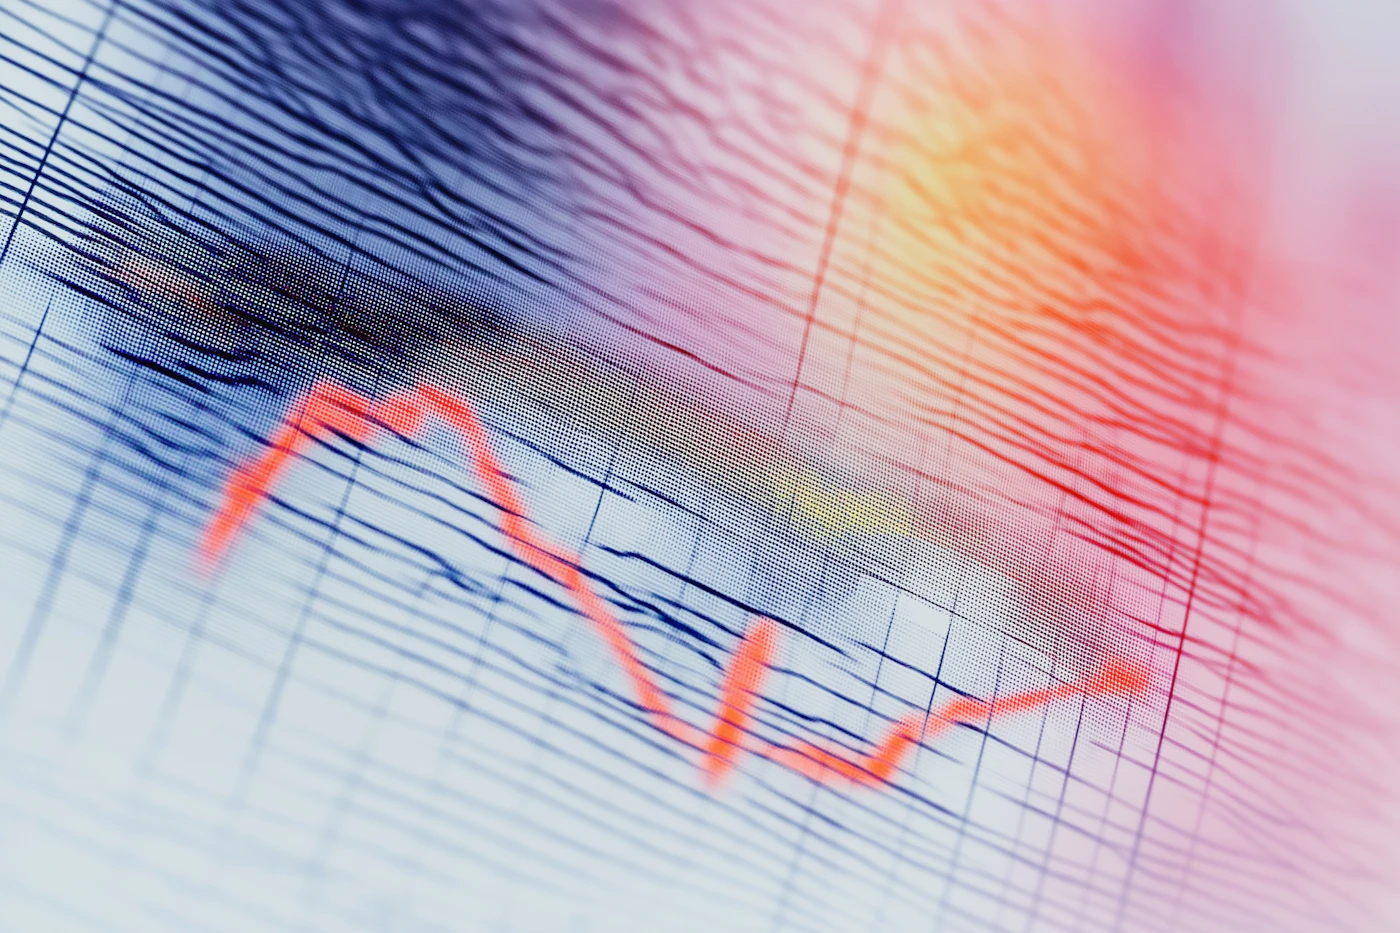

Financial Growth Chart
by SHIHO
Customize with AI
Open the playground with this illustration as your reference.
A close-up view of a graph with a red line chart prominently displayed against a grid background. The grid is composed of fine, intersecting lines, creating a textured and slightly distorted appearance.
The red line fluctuates, indicating changes in data over time, with peaks and troughs visible. The image is overlaid with a gradient of warm colors, including orange and pink, adding a dynamic and abstract quality.
The focus is soft, giving the scene an artistic and slightly blurred effect.
Hand-picked artworks that share the aesthetic, composition, and mood of this piece.
by SHIHO

by Mariate

by SHIHO

by Mariate

by Nika
by Nika

by SHIHO

by Mariana Pedroza

by Nika

by SHIHO

by SHIHO

by SHIHO

by SHIHO

by SHIHO

by SHIHO

by Nika