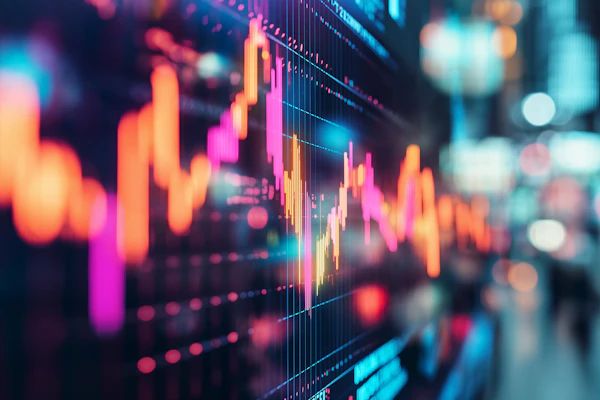
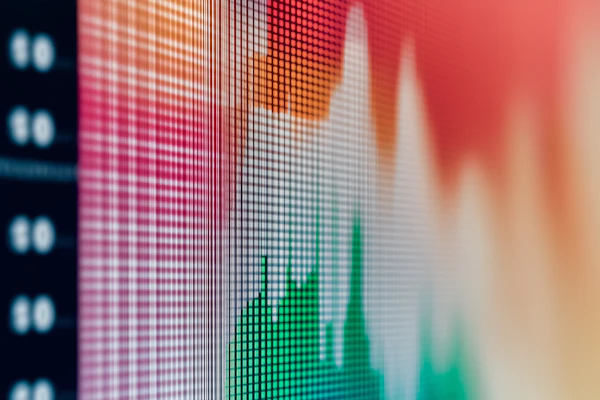
Futuristic Stock Chart
by SHIHO
Customize with AI
Open the playground with this illustration as your reference.
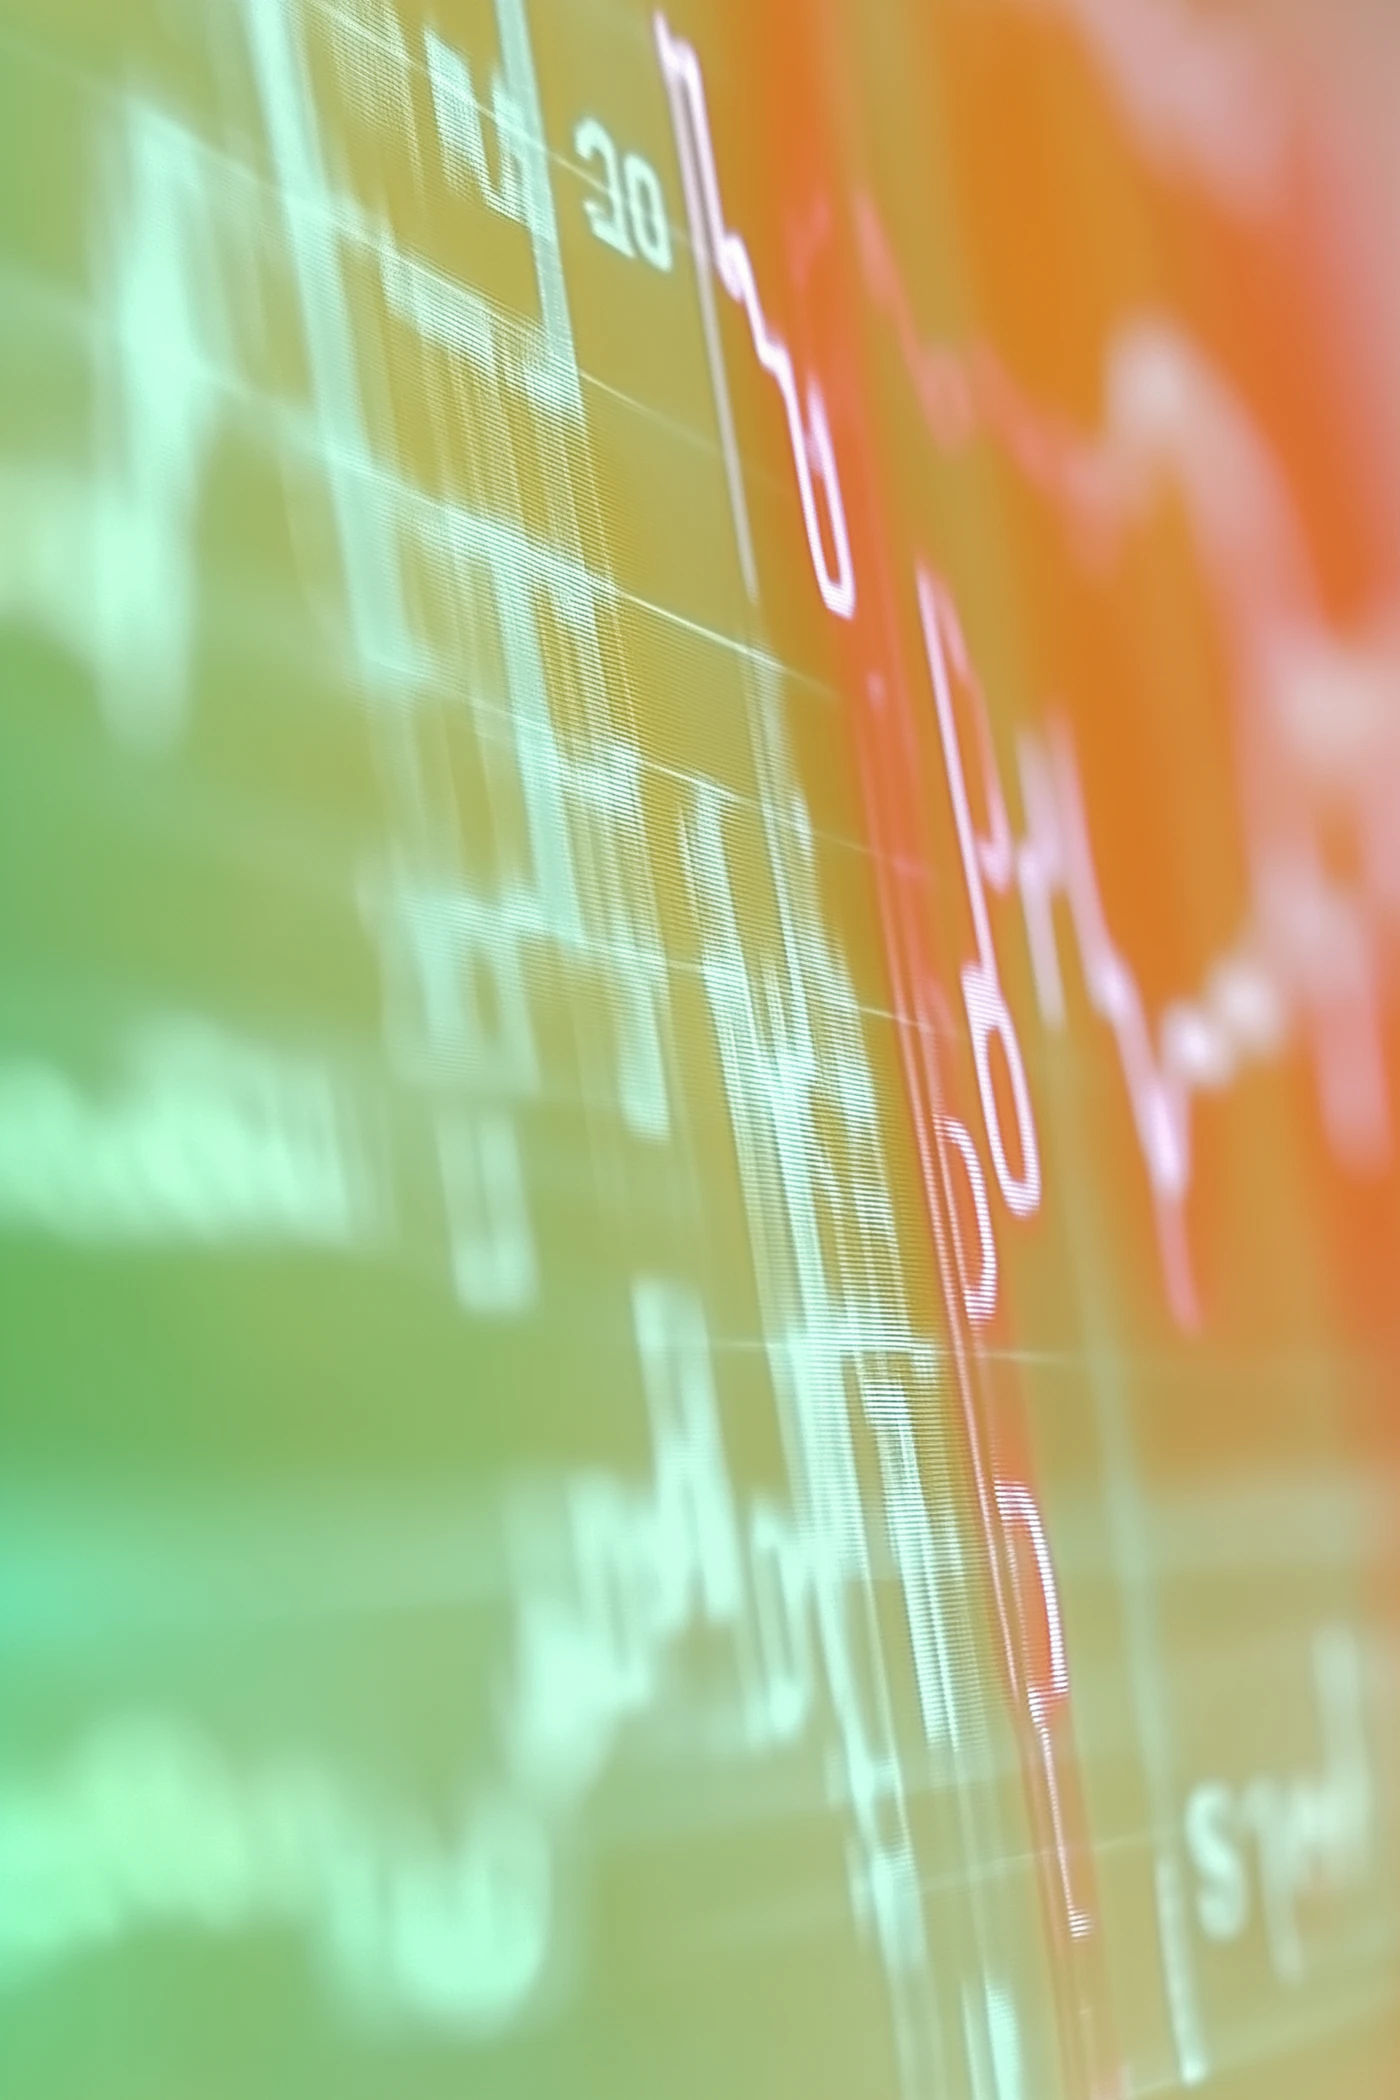
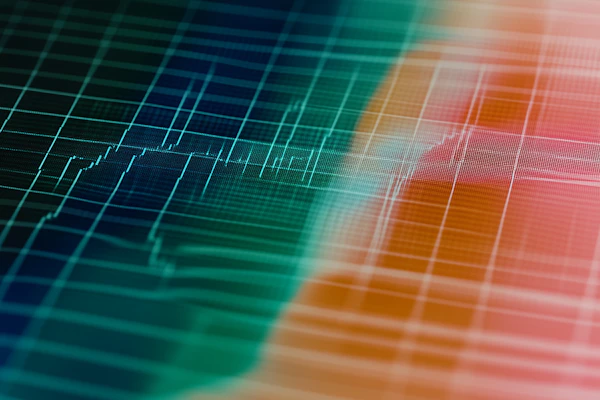
A blurred image of a financial chart with fluctuating lines in red and green tones. The chart appears to represent stock market data or financial trends, with numbers and lines indicating changes over time.
The background is a gradient of green and orange, creating a dynamic and vibrant visual effect. The focus is soft, emphasizing the abstract nature of the financial data rather than specific details.
この作品と美学・構図・雰囲気が近い作品を厳選。
by SHIHO
by SHIHO
by SHIHO
by SHIHO

by Pablo Stanley
by SHIHO

by Pablo Stanley

by SHIHO
by SHIHO

by Nika
by SHIHO
by Amino

by Nika

by rena

by SHIHO
by SHIHO