
Business Analytics and Reporting
by Viri Gutiérrez
Illustration by Viri Gutiérrez on Lummi
Customize with AI
Open the playground with this illustration as your reference.
Sélectionné pour des impressions d'art mural personnalisées.
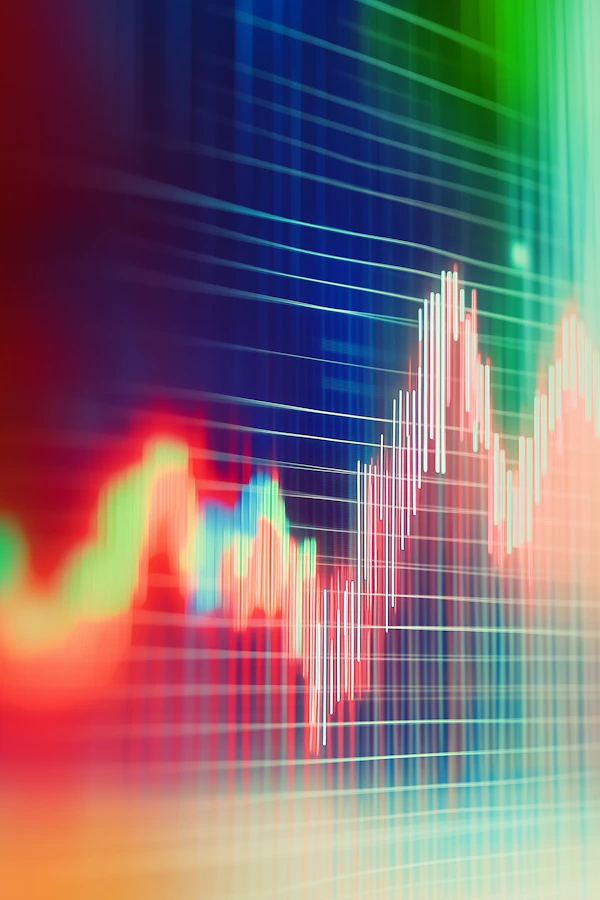
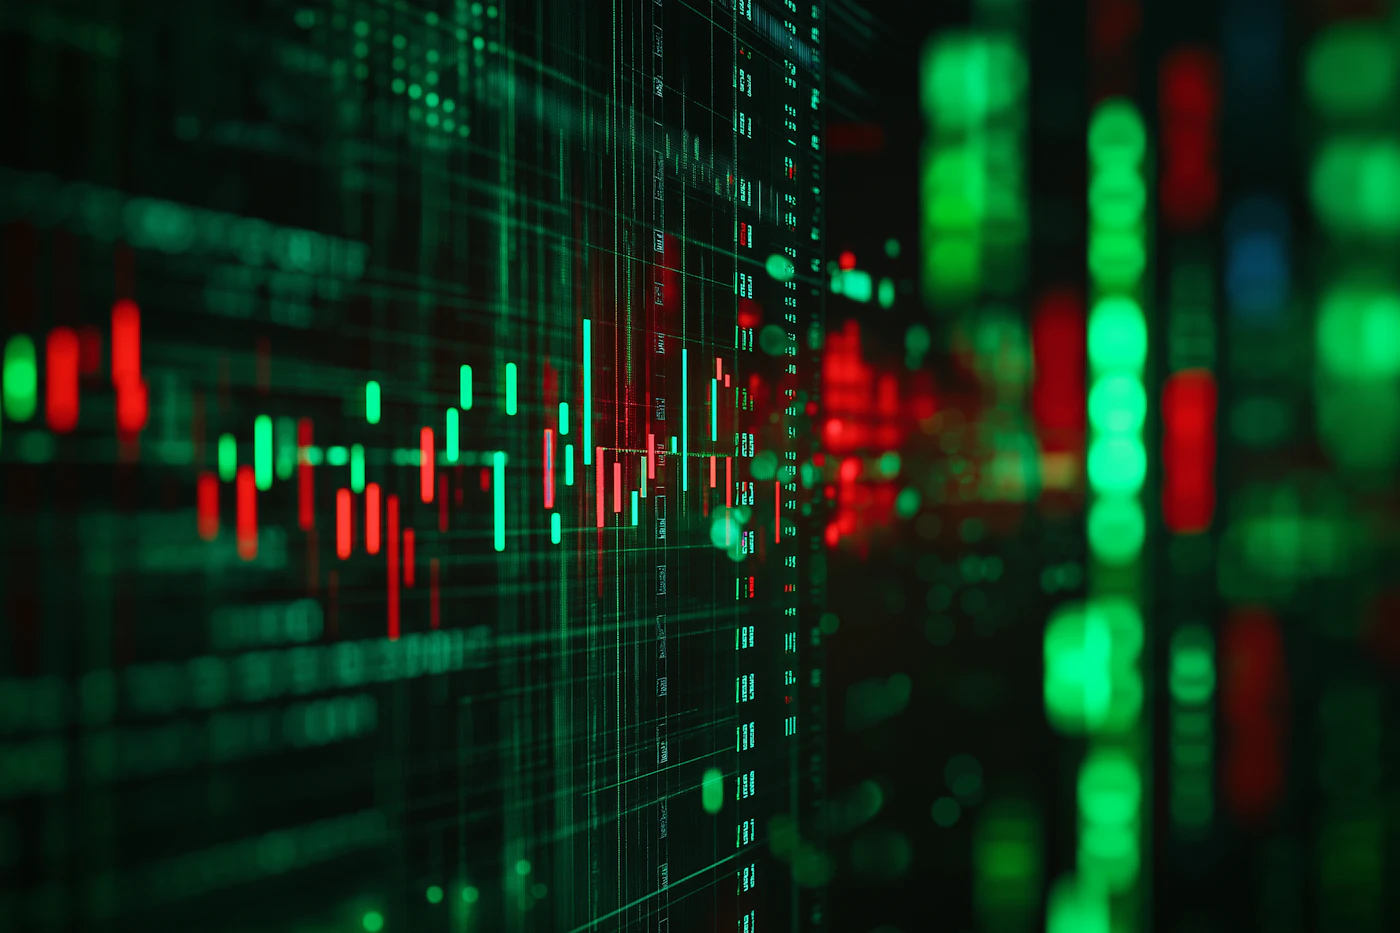
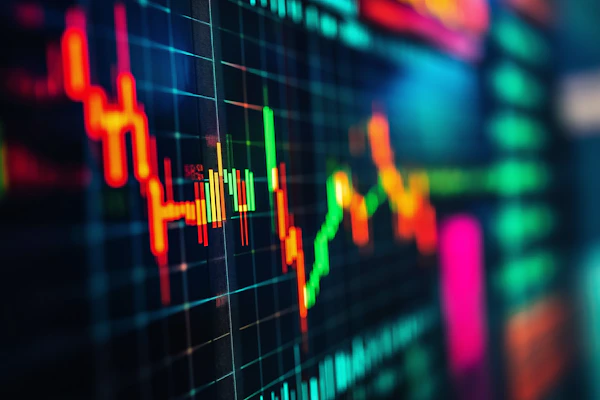
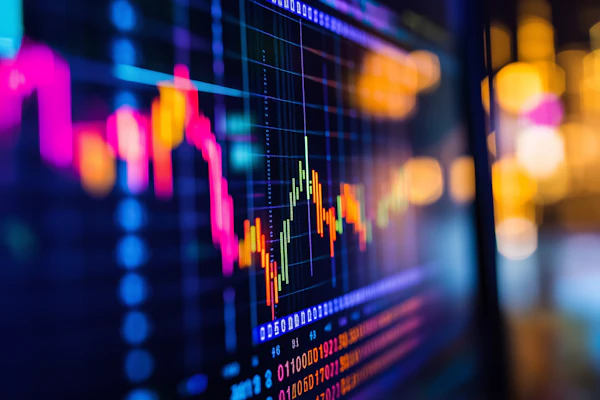
A dynamic and vibrant digital representation of a stock market or financial trading interface.
Customize with AI
Open the playground with this illustration as your reference.
A dynamic and vibrant digital representation of a stock market or financial trading interface. The image is dominated by green and red candlestick charts, symbolizing market trends and price movements.
The background is filled with a grid-like structure and numerical data, adding depth and complexity to the scene. The glowing green and red colors create a sense of urgency and activity, typical of financial trading environments.
The image is slightly blurred in some areas, emphasizing the fast-paced and dynamic nature of the stock market. The overall composition conveys a high-tech, data-driven atmosphere.
Œuvres choisies pour leur esthétique, leur composition et leur ambiance proches de cette pièce.
by Viri Gutiérrez

by SHIHO
by SHIHO
by SHIHO
by SHIHO

by Steph Meade
by Nika
by SHIHO
by SHIHO
by Nika
by SHIHO
by SHIHO

by SHIHO

by Steph Meade
by SHIHO
by SHIHO