Customize with AI
Open the playground with this illustration as your reference.
Customize with AI
Open the playground with this illustration as your reference.
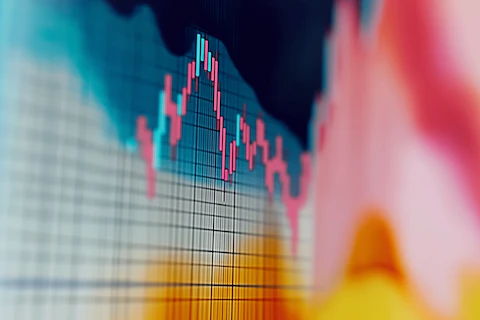
A vibrant and abstract representation of a financial chart with candlestick patterns. The chart features a grid background with fluctuating red and blue candlesticks, symbolizing market trends.
The colors blend into a gradient of warm tones like yellow and orange, transitioning into cooler shades of blue and pink. The image has a soft focus, giving it an artistic and dynamic feel, while the candlestick patterns remain the central element.
The blurred edges and color transitions create a sense of movement and energy, reflecting the volatility of financial markets.
この作品と美学・構図・雰囲気が近い作品を厳選。