Customize with AI
Open the playground with this illustration as your reference.
Customize with AI
Open the playground with this illustration as your reference.
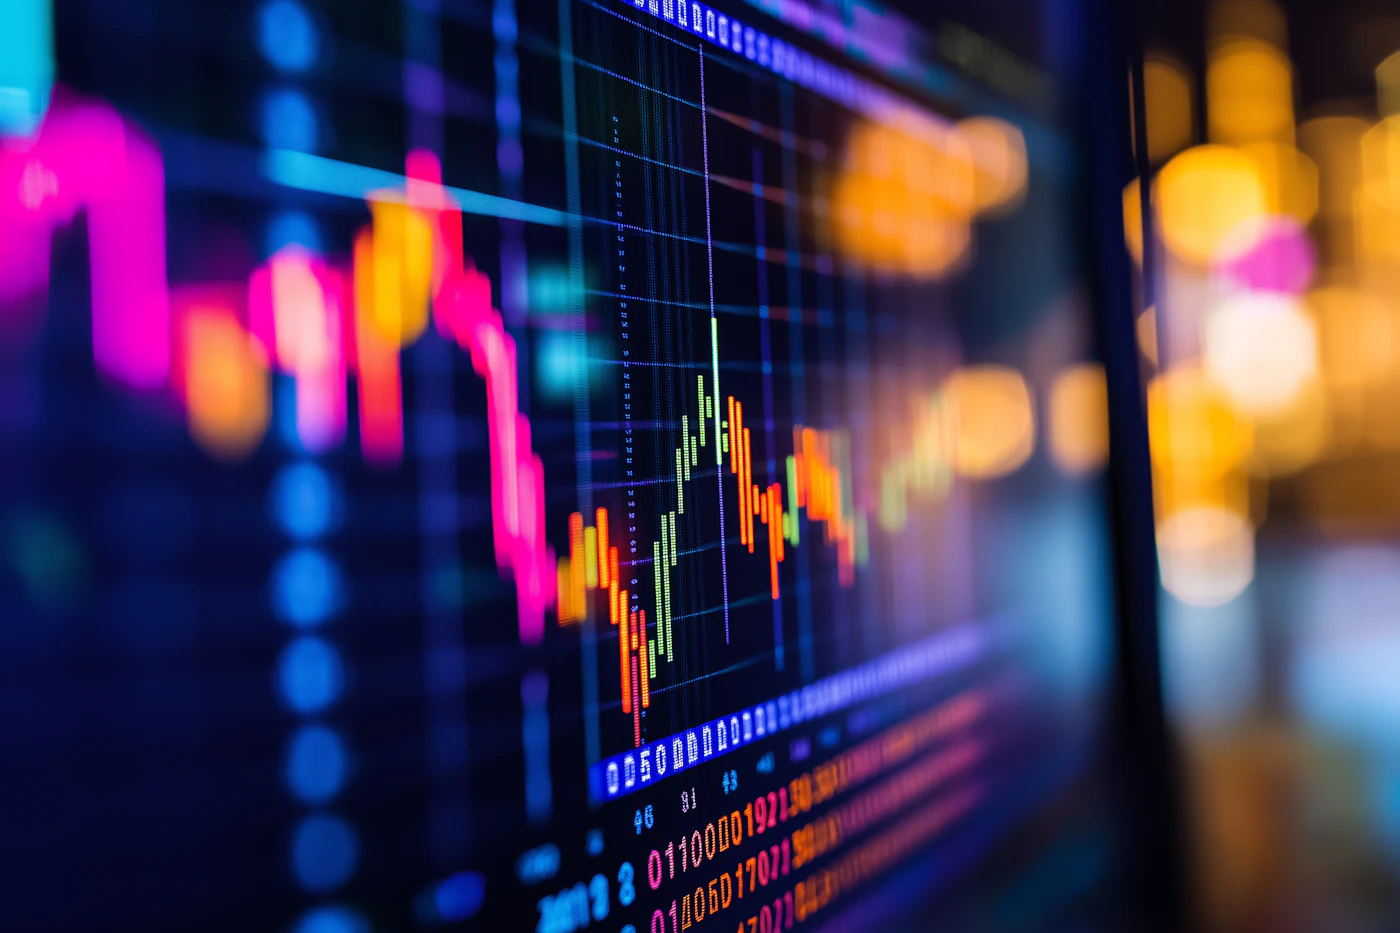
A vibrant and dynamic close-up of a financial trading chart displayed on a screen. The chart features colorful candlestick patterns in shades of pink, orange, green, and blue, representing market trends and fluctuations.
The background is blurred with warm yellow and orange bokeh lights, adding depth and a sense of activity. The screen also displays numerical data in rows, with some numbers highlighted in bright colors, emphasizing their importance.
The overall composition conveys a sense of energy and focus, typical of financial markets and trading environments.
この作品と美学・構図・雰囲気が近い作品を厳選。