Customize with AI
Open the playground with this illustration as your reference.
Customize with AI
Open the playground with this illustration as your reference.
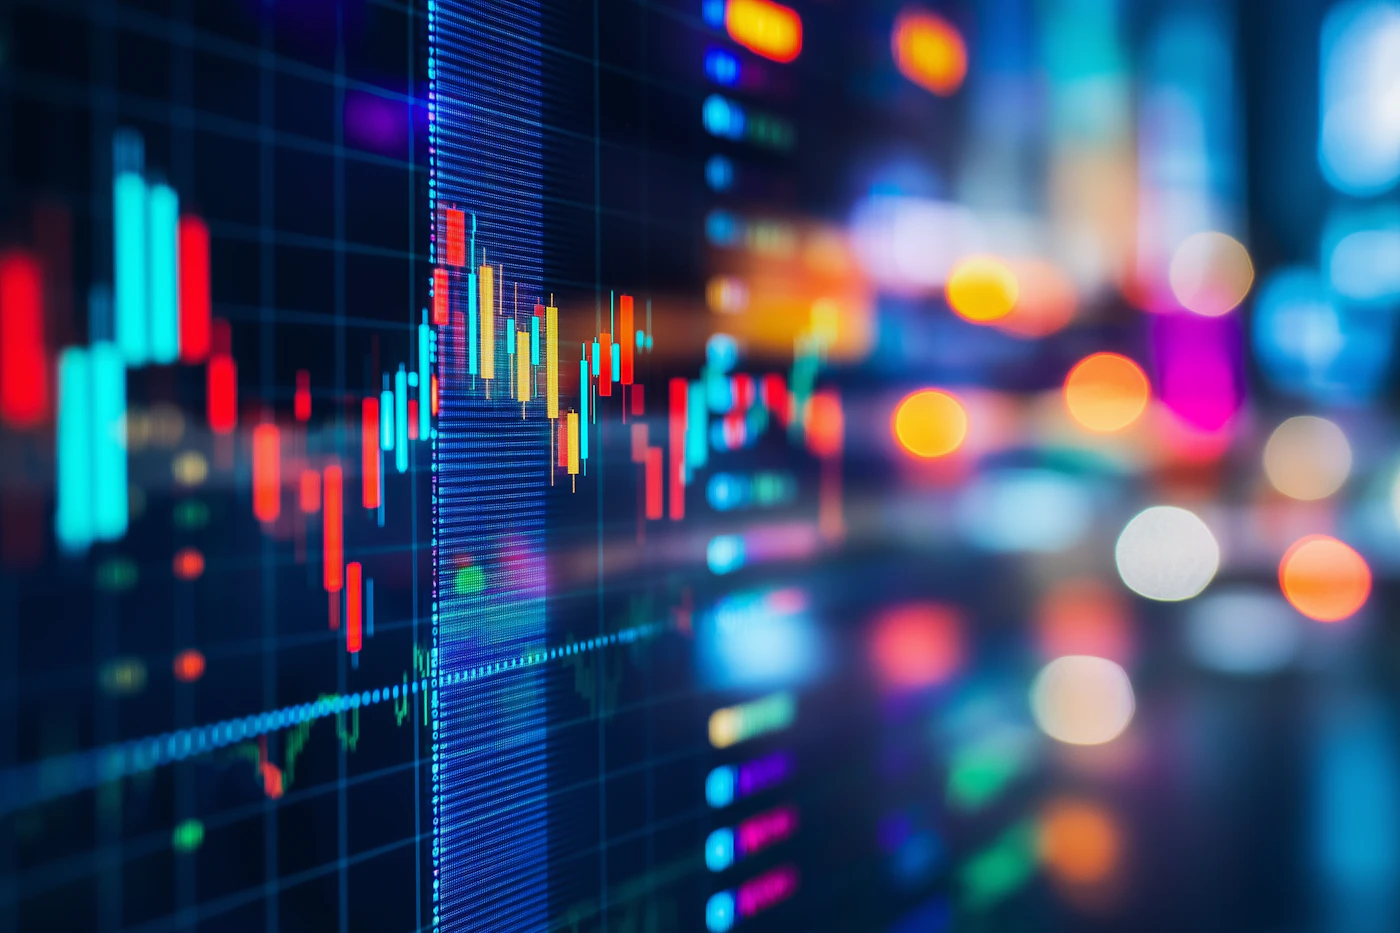
A vibrant and dynamic image of a financial trading chart displayed on a digital screen. The chart features colorful candlestick patterns in red, green, and blue, representing market trends and price movements.
The background is blurred with bokeh effects, showcasing bright, multicolored lights that add a futuristic and high-tech feel. The gridlines and numerical data on the chart emphasize the analytical nature of the scene, while the glowing colors create a sense of energy and activity.
The overall composition suggests a focus on stock market trading, financial analysis, or cryptocurrency markets.
この作品と美学・構図・雰囲気が近い作品を厳選。