Stock Market Analytics
by SHIHO
Customize with AI
Open the playground with this illustration as your reference.
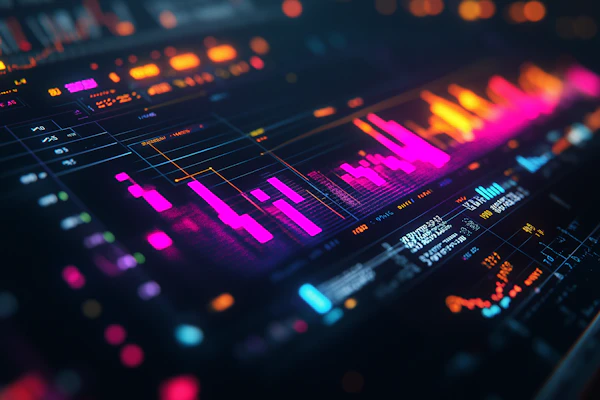
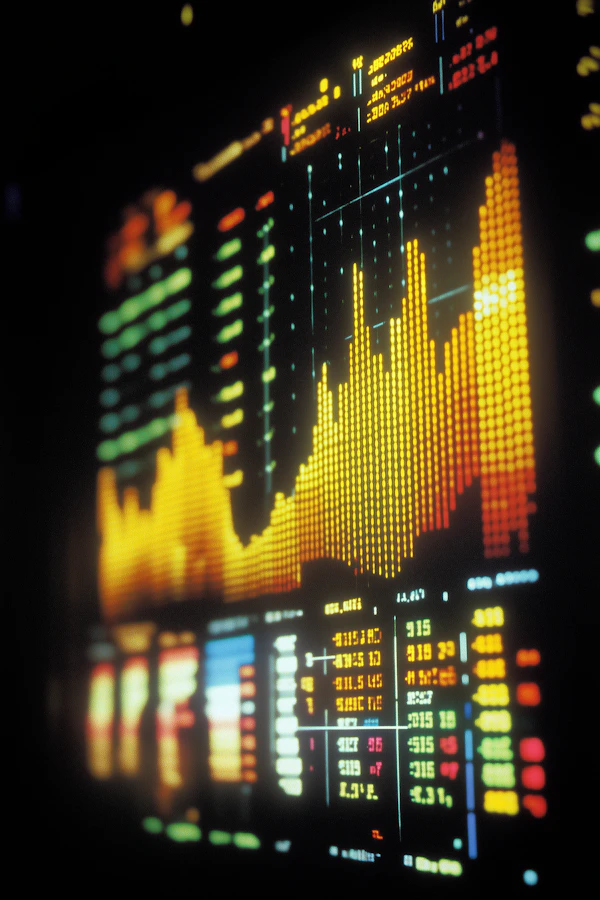
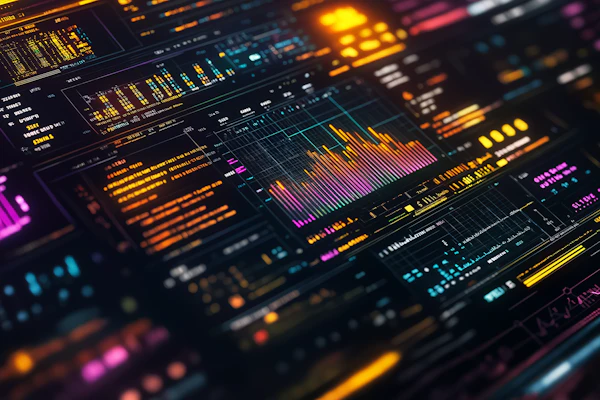
A vibrant and dynamic image of a digital stock market chart displayed on a screen. The chart features colorful candlestick patterns in shades of red, orange, and green, representing market fluctuations.
The background is a mix of blurred blue and purple lights, creating a futuristic and high-tech ambiance. The focus is on the chart, with its intricate details and glowing data points, while the surrounding elements remain out of focus, enhancing the sense of depth.
The overall composition conveys themes of finance, technology, and data analysis.
Hand-picked artworks that share the aesthetic, composition, and mood of this piece.
by SHIHO

by SHIHO
by SHIHO

by Nika

by Tanzim
by SHIHO

by SHIHO

by SHIHO
by Nika

by Nika
by Dona Mara
by SHIHO
by Amino
by Amino

by SHIHO

by SHIHO