
Dynamic Data Chart
by SHIHO
Customize with AI
Open the playground with this illustration as your reference.
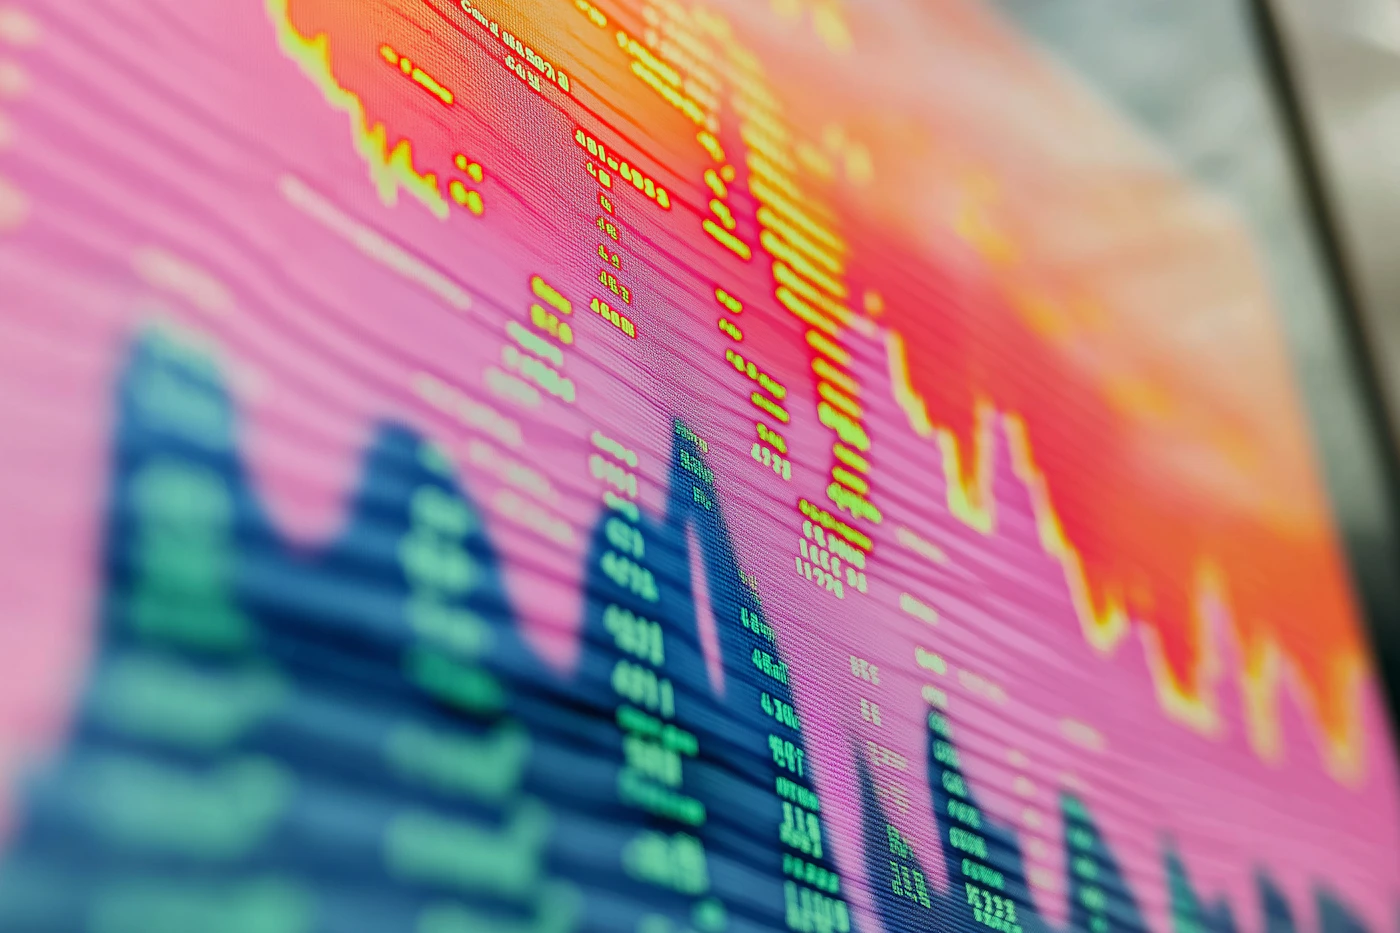
A vibrant and colorful close-up of a digital stock market chart displayed on a screen. The chart features a gradient background transitioning from pink to orange, with green and yellow numerical data and lines representing market trends.
Peaks and valleys of the graph are prominently visible, indicating fluctuations in stock values. The image is slightly blurred, emphasizing the dynamic and fast-paced nature of financial data.
The perspective is angled, adding depth and a sense of movement to the composition.
Hand-picked artworks that share the aesthetic, composition, and mood of this piece.
by SHIHO

by SHIHO

by SHIHO

by SHIHO

by Amino

by Pablo Stanley

by rena

by SHIHO

by SHIHO

by SHIHO
by SHIHO

by Nika

by SHIHO

by SHIHO

by SHIHO

by SHIHO